
What the 25,000 scenarios showed
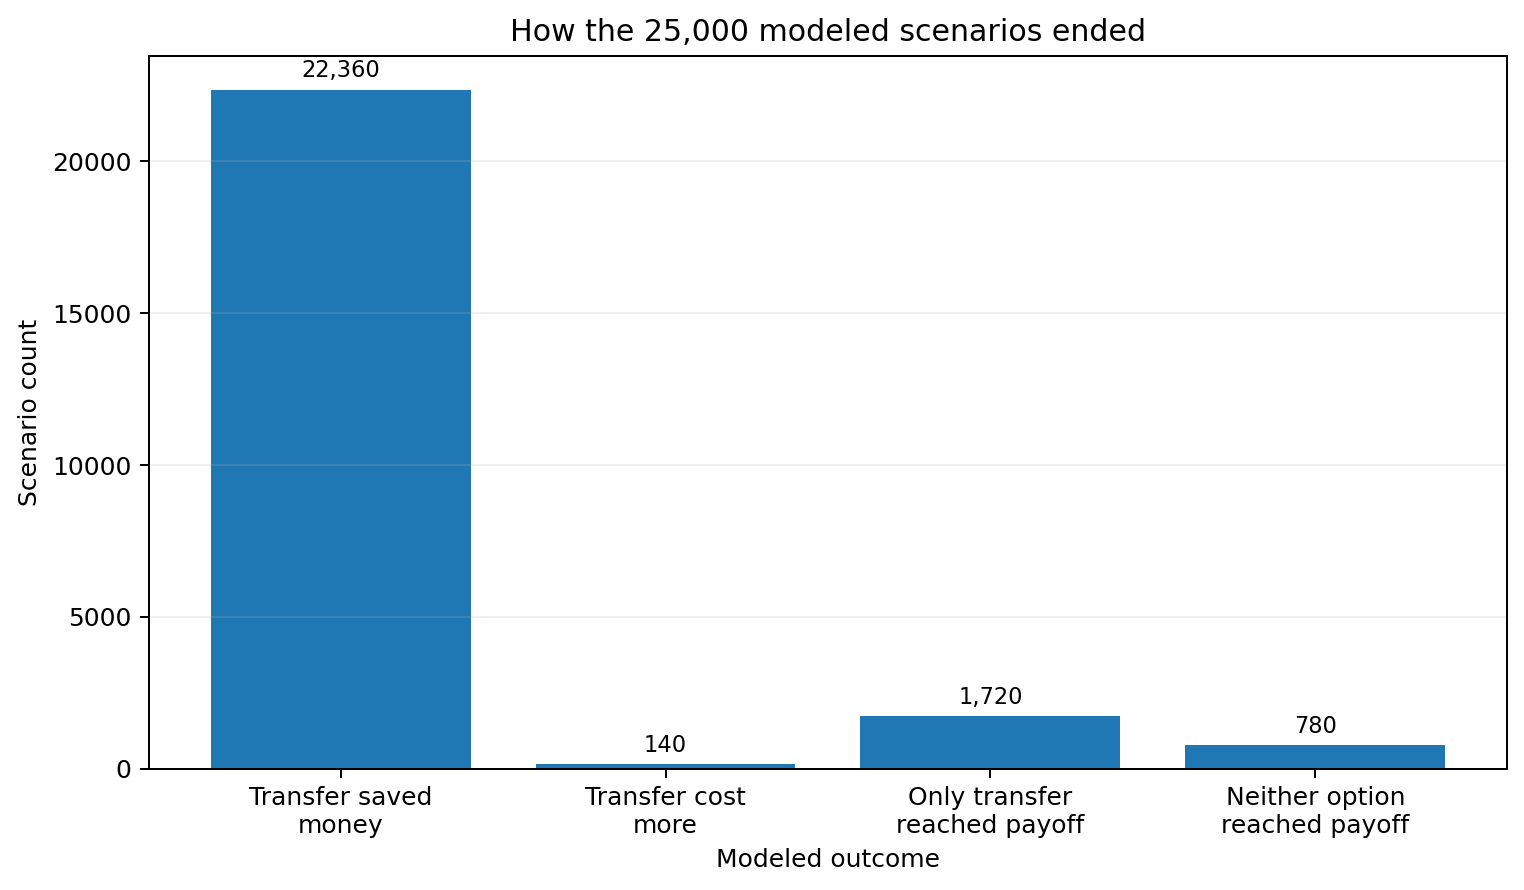
Across the 22,500 scenarios where both options reached payoff, the transfer cost more in 140. Those 140 cases came from a small set of combinations involving shorter promo periods, lower monthly payments, transfer fees, lower starting APRs, and a post-promo APR set 5 percentage points higher.
The transfer saved money in 22,360 of those 22,500 scenarios, or 99.38%.
Every scenario has the same weight in this study. The grid was built from defined combinations of balances, APRs, payments, fees, and promo terms. The 99.38% figure describes this model and doesn't estimate how often real cardholders will save with a balance transfer.
What we tested
We built 25,000 scenarios from a fixed set of balances, APRs, monthly payments, transfer fees, promo periods, and post-promo APRs. Every combination was tested once.
The full methodology near the bottom of the page lists every balance and APR used in the study.
Among the 22,500 scenarios where both options reached payoff, the median modeled savings were $2,282.39.
Among scenarios where both options reached payoff, the median payoff time was six months shorter with the transfer.
They used shorter promos, lower payments, a transfer fee, lower current APRs, and a post-promo APR 5 percentage points higher.
Every modeled transfer paid off during the 0% period had a lower financing cost than the current-card option.
Where the balance transfer cost more
The 140 scenarios where the transfer cost more came from 14 combinations of APR, payment rate, fee, promo length, and post-promo APR setting. The table shows the values that appeared across those cases.
| Study setting | Values present in all 140 scenarios where the transfer cost more |
|---|---|
| Current APR | 9.99%, 12.99%, or 15.99% |
| Fixed monthly payment | 2% or 3% of starting balance |
| Transfer fee | 3%, 4%, 5%, or 6% |
| 0% promotional period | 12 or 15 months |
| Post-promotional APR | Current APR + 5 percentage points, capped at 36% |
Every scenario where both options reached payoff saved money when the post-promo APR stayed equal to the current APR. No scenario in the 18-, 21-, or 24-month promo groups cost more after the transfer. The same was true for the 4%, 5%, and 7.5% fixed-payment groups.
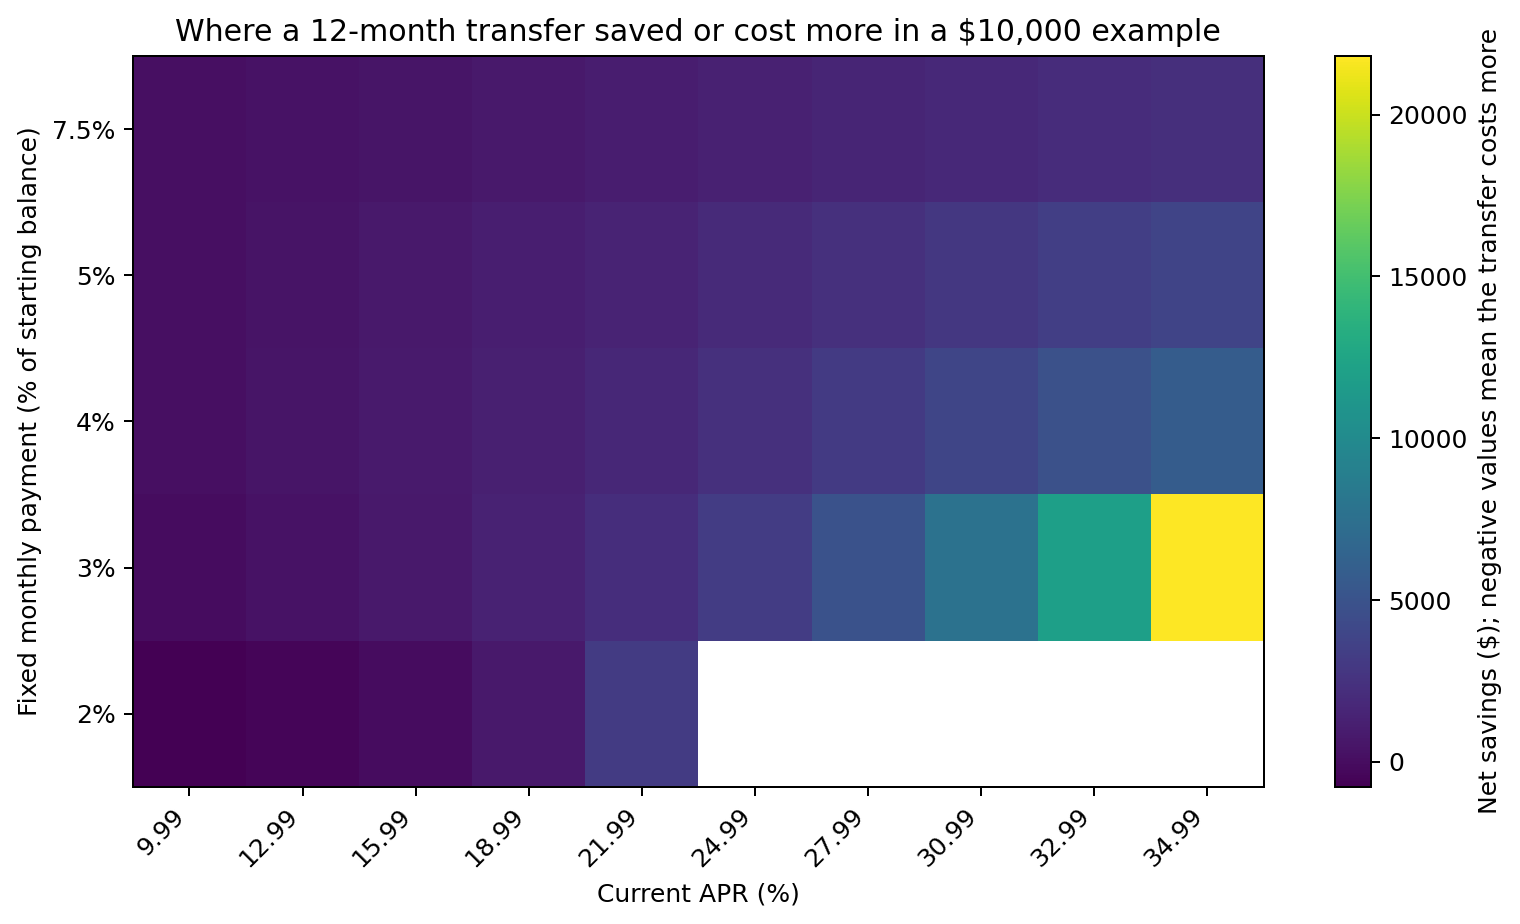
Among scenarios where both options reached payoff and a balance remained after the promo, 99.16% still saved money. A larger remaining balance gives the regular APR more months to affect the final cost, especially when that APR is higher than the starting rate.
Longer 0% periods changed the result
The transfer cost more in 2.44% of the 12-month comparisons and 0.67% of the 15-month comparisons. No scenario in the 18-, 21-, or 24-month groups cost more under these study assumptions.
The percentages below use only scenarios where both options reached payoff.
| 0% promo | Transfer cost more | Median net savings |
|---|---|---|
| 12 months | 2.44% | $1,764.21 |
| 15 months | 0.67% | $2,147.43 |
| 18 months | 0.00% | $2,412.48 |
| 21 months | 0.00% | $2,564.85 |
| 24 months | 0.00% | $2,647.98 |
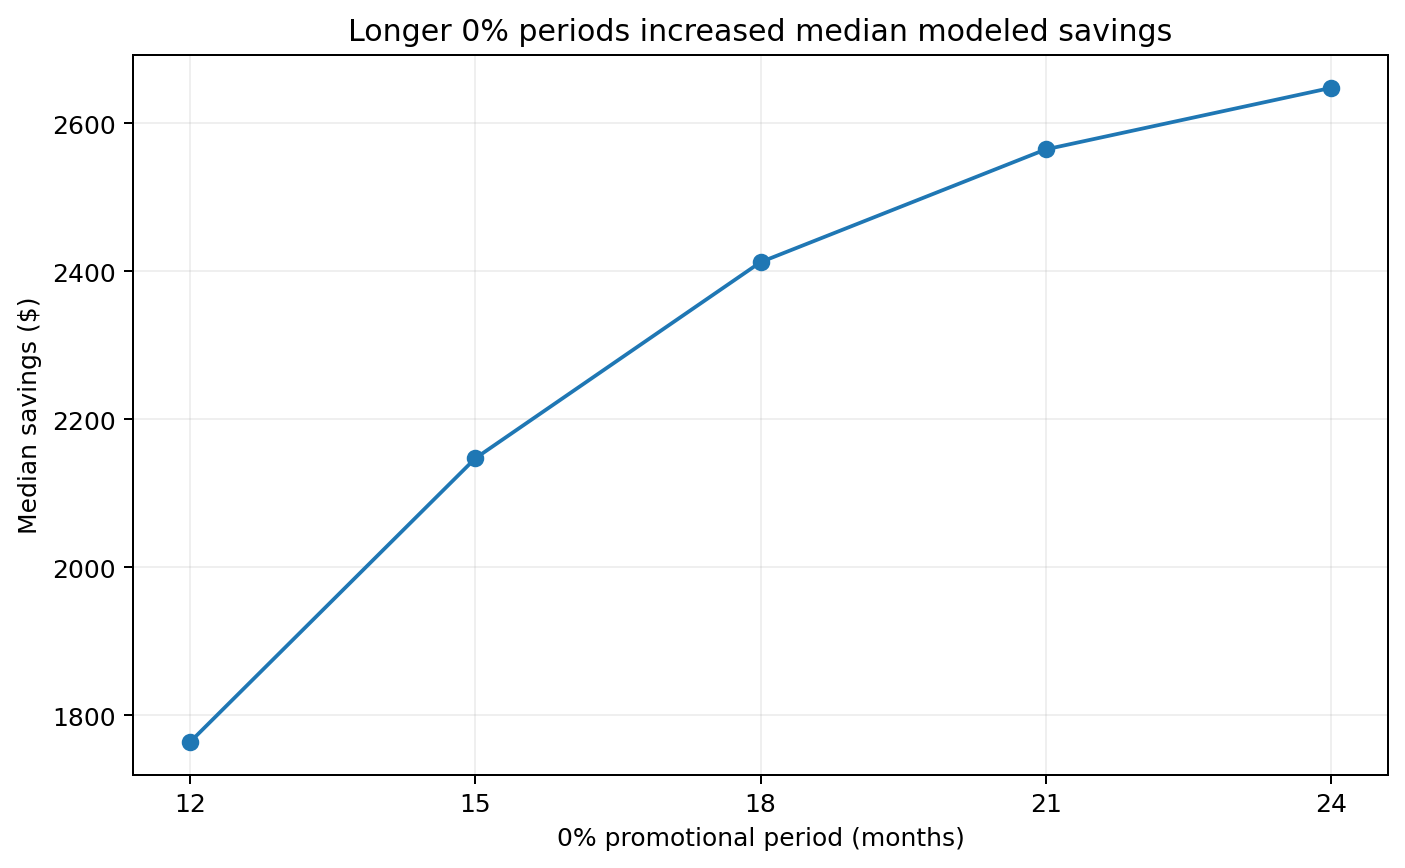
The 18-, 21-, and 24-month results belong to this exact scenario grid. Different fees, payments, approved transfer amounts, annual fees, issuer rules, or post-promo terms can change the result.
Higher transfer fees cut into the savings
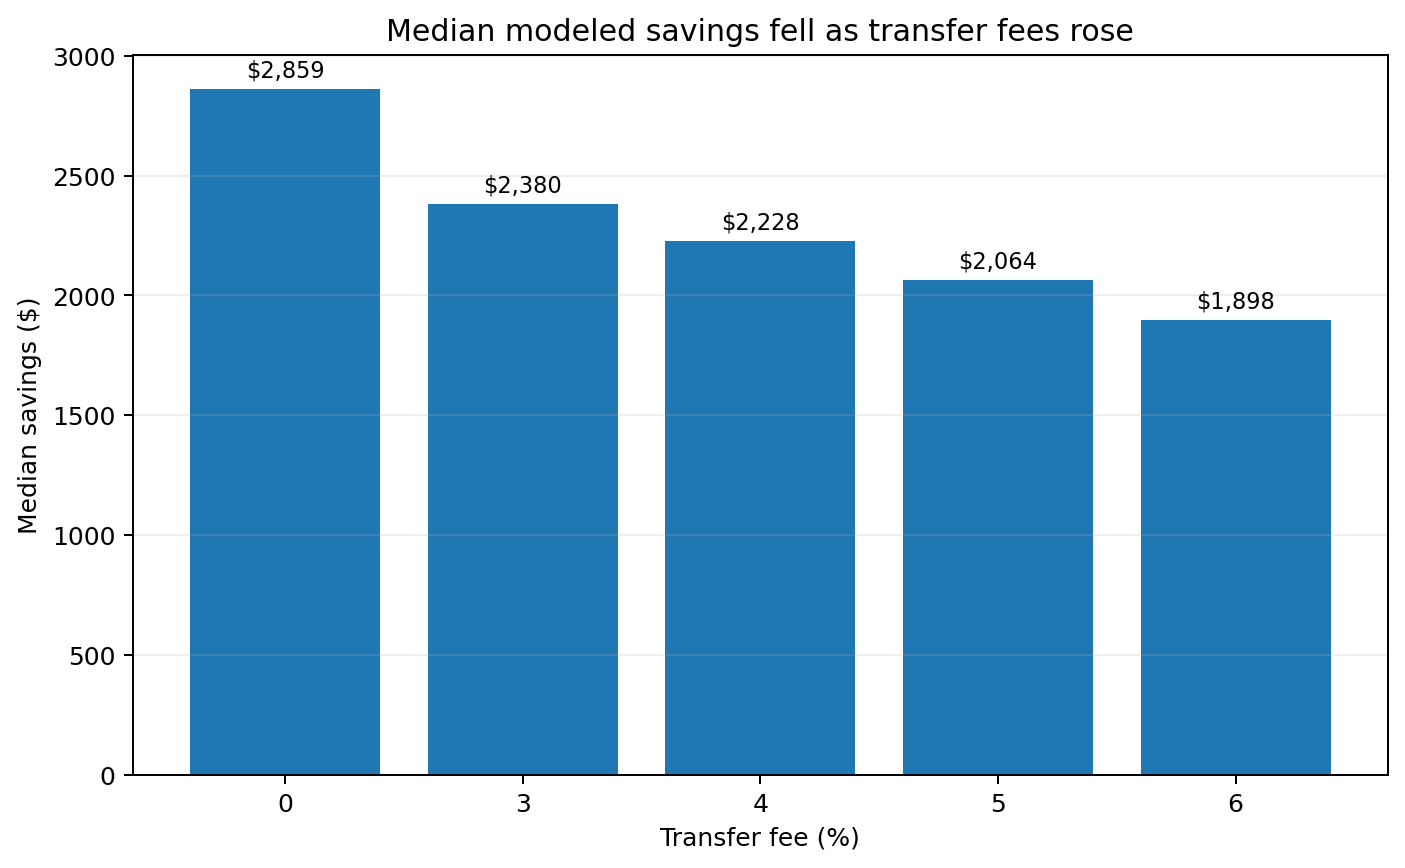
Median savings fell at each fee step, from $2,859.35 in the 0% fee baseline to $1,897.82 at a 6% fee. The final result also changed with APR, payment size, promo length, and the post-promo APR.
The percentages and median savings below use only scenarios where both options reached payoff.
| Transfer fee | Transfer saved money | Median net savings |
|---|---|---|
| 0% fee baseline | 100.00% | $2,859.35 |
| 3% | 99.78% | $2,379.80 |
| 4% | 99.33% | $2,227.90 |
| 5% | 98.89% | $2,064.39 |
| 6% | 98.89% | $1,897.82 |
The 0% fee row gives us a baseline for measuring the effect of the fee. The study also tests 3%, 4%, 5%, and 6% fees. Across the scenarios with those fees, the transfer saved money in 99.22% of cases where both options reached payoff. Median net savings were $2,147.82.
Payment size affected how much balance reached the end of the promo
The study calculates the monthly payment as a percentage of the original balance, converts it to a fixed dollar amount, and uses that same payment for both options. Keeping the payment steady makes the offer terms easier to evaluate on the same footing.
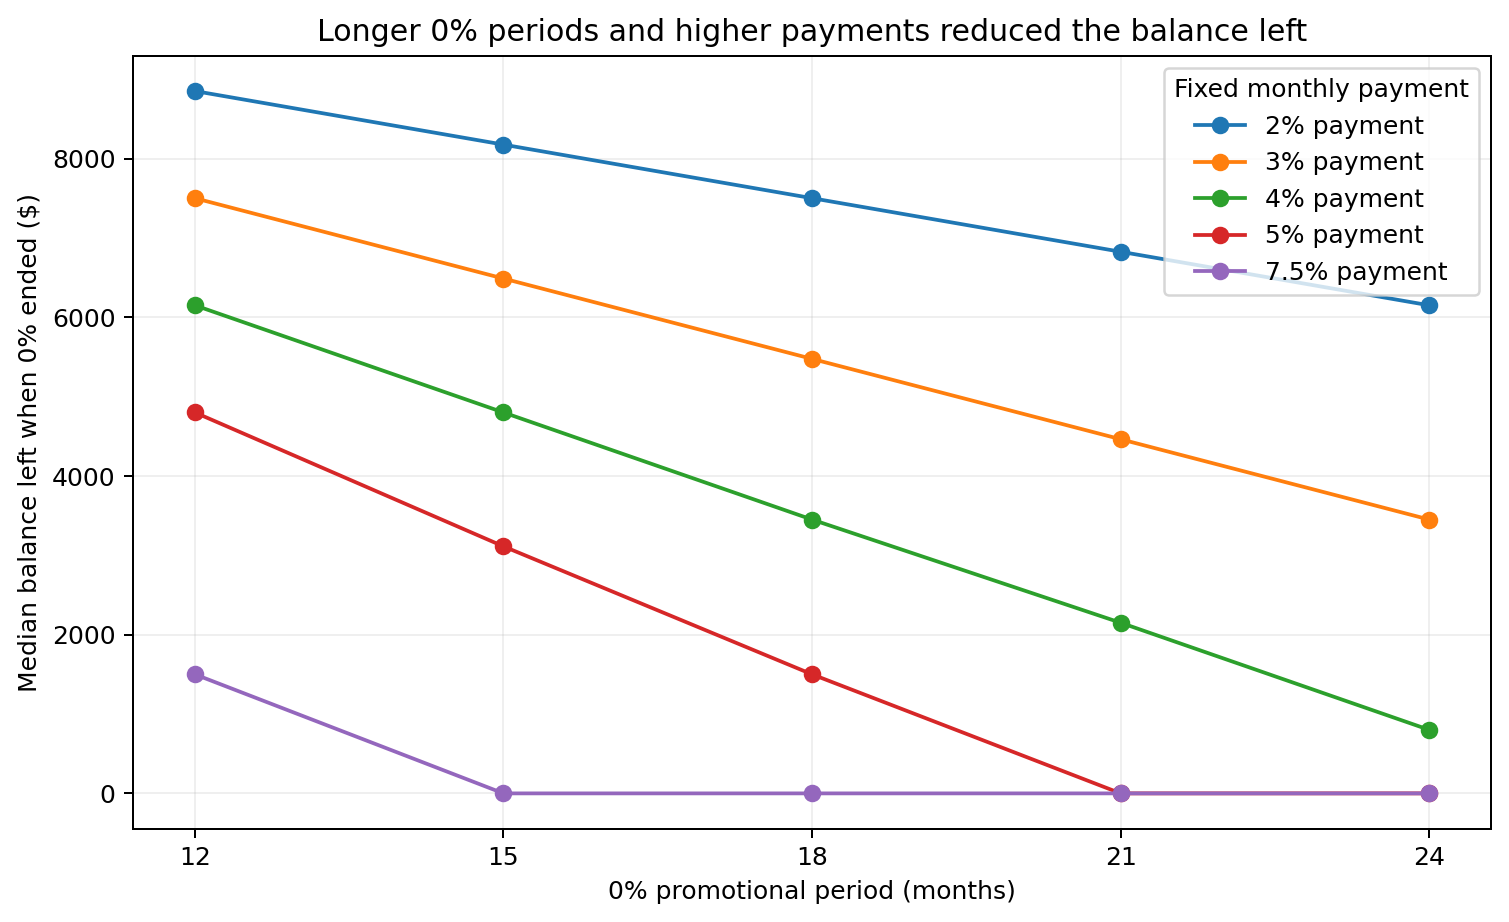
In this grid, the 2%, 3%, and 4% payment levels never cleared the transferred balance during the 0% period. A 5% payment did so in 36% of scenarios, while a 7.5% payment did so in 80%.
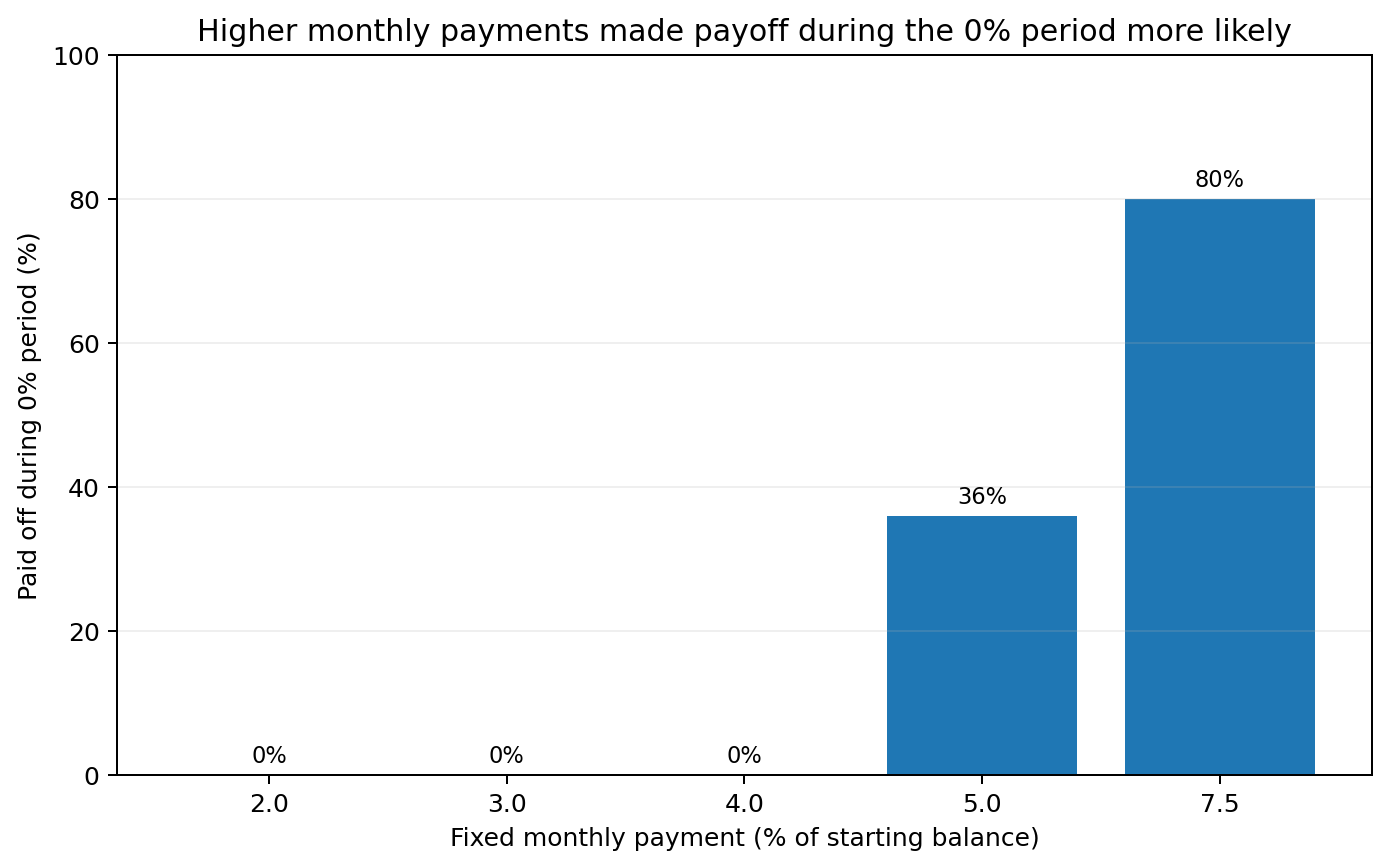
All 5,800 transfers that were paid off during the promotional period saved money. Every one of the 140 scenarios where the transfer cost more had a balance remaining after the promo ended.
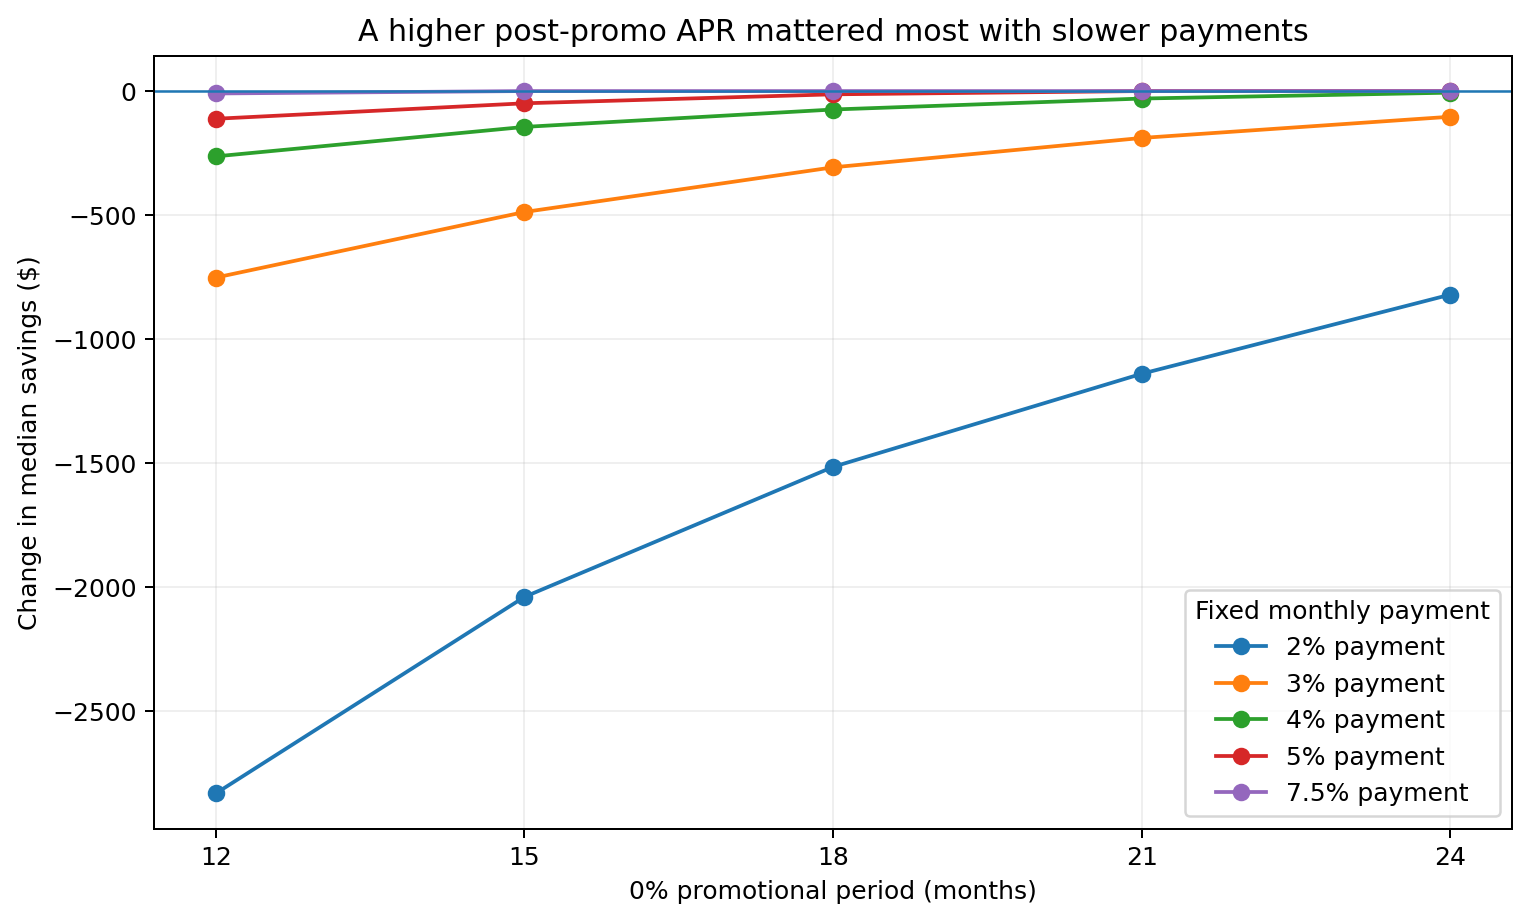
The higher post-promo APR had the biggest effect with slower payoff
Every primary scenario was modeled twice: once with the post-promotional APR equal to the current APR, and once with the post-promotional APR 5 percentage points higher, capped at 36%.
Across all paired scenarios, raising the post-promo APR by 5 percentage points reduced median net savings by $34.18. The effect was much larger at the slower payment levels. With a 2% payment, 5% fee, and 12-month promo, median savings fell by $2,831.58.
Break-even APR for a $10,000 example
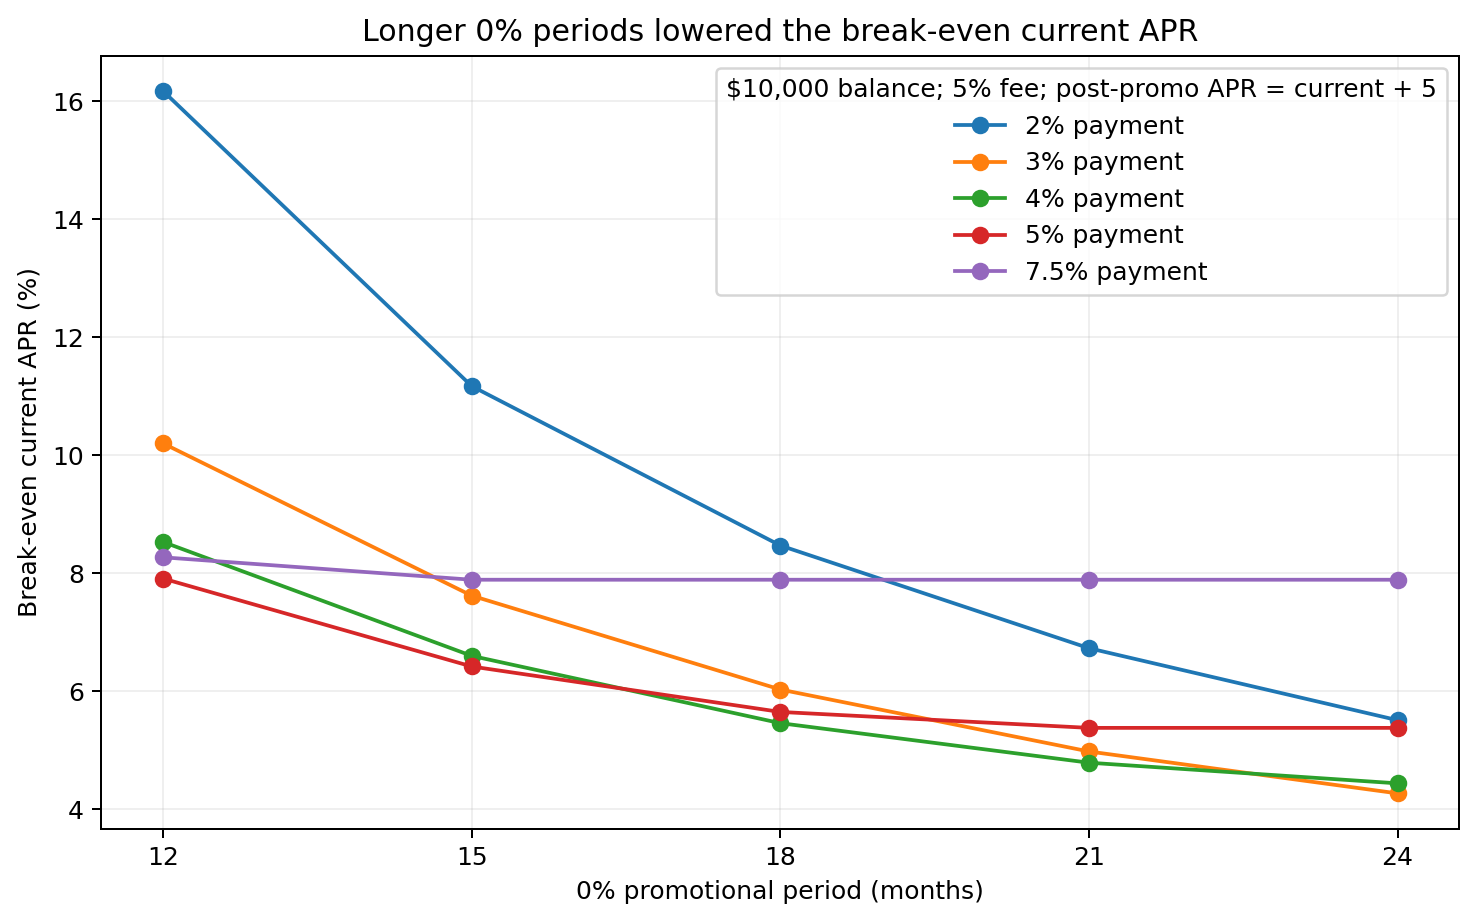
We also calculated the break-even APR for selected assumptions. Here, break-even is the lowest current APR where the transfer's modeled cost is equal to or lower than keeping the balance on the current card.
For a $10,000 balance, a fixed $200 monthly payment, a 5% transfer fee, and a post-promo APR 5 percentage points higher than the current APR, the break-even APR moved lower as the 0% period got longer:
| 0% promo | Break-even current APR |
|---|---|
| 12 months | 16.17% |
| 15 months | 11.17% |
| 18 months | 8.47% |
| 21 months | 6.73% |
| 24 months | 5.51% |
What happened when the fixed payment didn't reach payoff
The current-card option didn't reach payoff in 2,500 scenarios, or 10% of the full grid. These were the 2%-payment cases at current APRs of 24.99%, 27.99%, 30.99%, 32.99%, and 34.99%.
Of those 2,500 cases, the transfer reached payoff in 1,720, while neither option reached payoff in 780.
The study uses a fixed dollar payment. Credit card issuers can use different minimum-payment formulas, so these 2,500 cases apply to the payment rule used in this study.
Run your own comparison
Use your actual balance-transfer offer
The study covers a fixed set of scenarios. Use the Balance Transfer Savings Calculator to enter your own balance, APR, fee, promo period, post-promo APR, and monthly payment.
Methodology
We built a fixed scenario grid and ran every combination once. That produced 25,000 scenarios with no random sampling.
That produces this 25,000-scenario matrix:
The promotional APR is 0% in every primary scenario. The transfer fee is added to the transferred balance. Each payment rate is converted to a fixed dollar payment from the original starting balance, and that same dollar payment is used for both options.
How we calculated cost
For the current card, modeled cost is the interest charged through payoff. For the transfer, modeled cost is the transfer fee plus any interest charged after the 0% period. When both options reach payoff, savings equal the current-card cost minus the transfer cost.
How we checked the calculations
All dollar calculations use exact cent rounding. We then recalculated the full 25,000-row dataset with a separate calculation method. The results matched across all 25,000 rows and all 250 break-even checks, with zero discrepancies in the certified fields.
The downloadable methodology and calculation verification report include the rounding rules, verification checks, and version information for this release.
What the study leaves out
- Card approval probability or approved transfer limits
- Partial transfers
- Issuer-specific minimum-payment formulas
- New purchases, cash advances, late fees, penalty APRs, or missed payments
- Loss of a promotional rate because of account behavior
- Transfer processing delays or offer deadlines
- Annual fees, rewards, credit-score effects, or utilization effects
- Real-world weighting of balances, APRs, payments, or offer availability
We included the 24-month promo and 0% fee cases to see how the results changed at the edges of the ranges we tested.
How to cite this study
Michael Brady. “We Modeled 25,000 Balance-Transfer Scenarios to See When a Transfer Saves Money.” DebtOptimizerHub, August 22, 2026. https://debtoptimizerhub.com/research/balance-transfer-scenarios
Reuse and attributionCharts and data from this study may be reused under the Creative Commons Attribution 4.0 International license. When reused online, please credit DebtOptimizerHub and link to this study.
Download the data
The complete dataset is available so you can inspect the study directly. It contains 25,000 scenario rows with the inputs and modeled outputs used in the analysis.
Research data
Download the 25,000-scenario CSV
Methodology version 1.1 · 25,000 unique scenario IDs · exact-cent calculation checks completed.
Debt Payoff Planner
Build and track the payoff plan around your decision
Compare payoff strategies, track monthly progress, and keep your projection updated after a balance transfer or another change to your debt plan.
Balance-transfer research FAQ
Does a 0% balance transfer always save money?
Some scenarios in the grid cost more after the transfer fee and post-promo interest were included. Those cases appeared with shorter promo periods, lower payments, lower current APRs, and a post-promo APR set 5 percentage points higher.
Why use the same monthly payment for both options?
Keeping the payment the same puts both options under the same repayment assumption. A higher payment speeds up payoff on its own, so the main study holds the monthly payment steady.
Why do some scenarios end without a payoff date?
At some high-APR and low-payment combinations, the fixed payment doesn't bring the balance to payoff within the study horizon. We report those cases separately with their payoff status.
Do the 25,000 scenarios represent real-world consumer behavior?
The grid gives every modeled combination the same weight. Its percentages describe the study scenarios and don't estimate how common any balance, APR, payment pattern, approval outcome, transfer limit, or card offer is in the real world.