DebtOptimizerHub research

Original research on debt payoff decisions

Explore scenario-based studies built from defined assumptions, published calculation rules, downloadable datasets, and verification checks. Each study shows exactly what was tested, what the results say, and where the analysis stops.

2original studies
37,000published study rows
15research charts
2verification reports

Latest research

How an extra $25 changes credit-card payoff

The current research focuses on how payment size changes credit-card payoff results, then lets you inspect every tested combination in the certified scenario grid.

Credit card payoff · September 2026

How Every Additional $25 Changes Credit Card Payoff Time

12,000 comparisons across 600 baseline profiles show how each $25 monthly-payment increase changes payoff time and interest, including the point where a payment increase creates a payoff path.

12,000comparisons
600baseline profiles
7research charts
Interactivescenario explorer
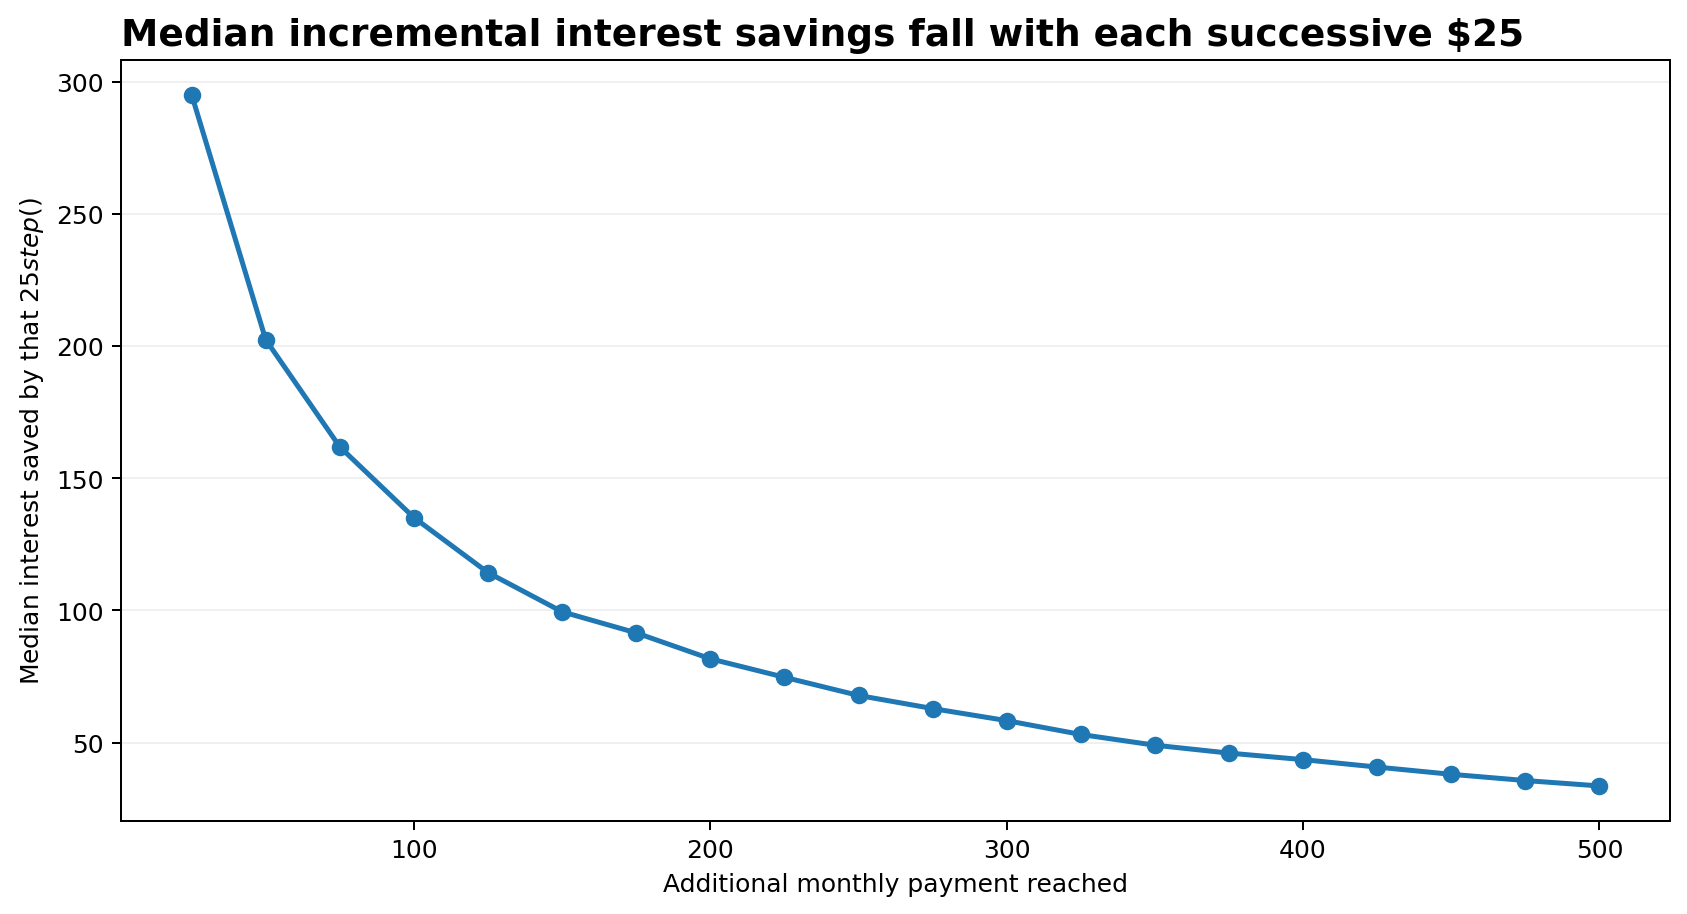
Study preview Chart from the extra-payment study showing the declining median incremental interest savings from each successive $25 monthly-payment increase.
Balance transfers · August 2026

25,000 Balance-Transfer Scenarios

See how current APR, transfer fees, promotional periods, monthly payment size, and post-promotional APR change financing cost, payoff results, and the balance left when a promotional period ends.

25,000scenarios
8research charts
CSVdownloadable dataset
Verifiedcalculation report
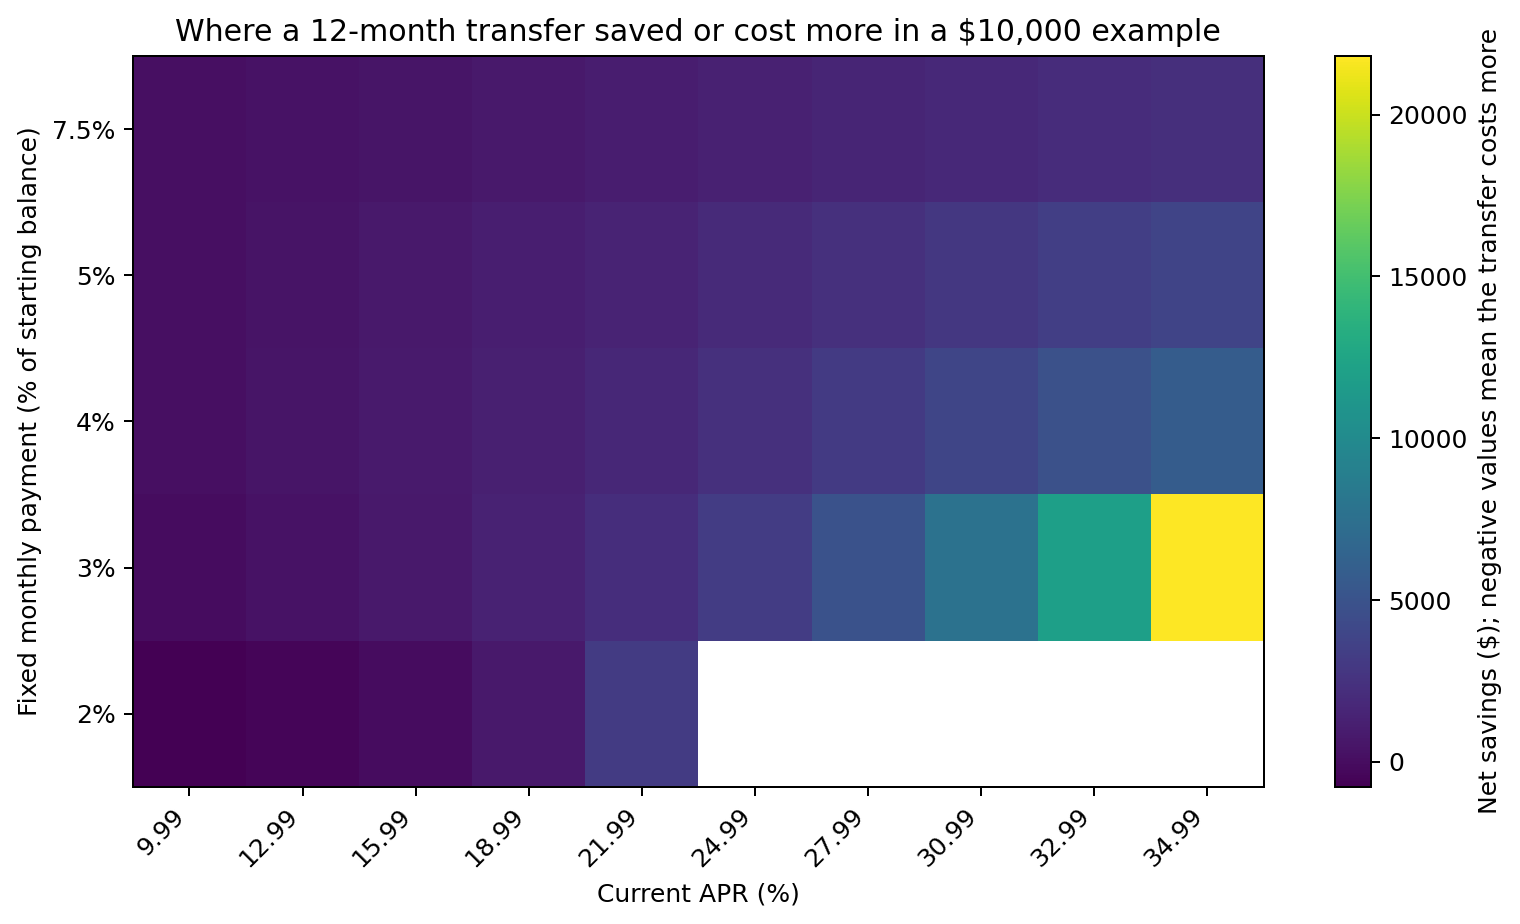
Study preview Heatmap from the balance-transfer study showing net savings for a $10,000 12-month transfer across current APRs and fixed monthly payment rates.

Research approach

How DebtOptimizerHub research works

Each project follows a defined pipeline so the published findings can be traced back to the tested scenarios and calculation rules.

1

Define the question

Start with a specific debt or credit-card decision and define the outputs the study needs to measure.

2

Build the scenario grid

Set the tested balances, rates, payments, terms, and other assumptions before calculating the results.

3

Verify the calculations

Run deterministic checks and independent verification against the published calculation rules.

4

Publish the evidence

Release the findings with charts, limitations, methodology, and downloadable data readers can inspect.

Publication standards

Built to be checked and reused

The research pages include more than headline findings. The supporting material is published so readers, journalists, and other publishers can inspect how each result was produced.

Transparent methodology

Defined scenario ranges, formulas, rounding rules, assumptions, edge-case handling, and stated limitations.

Downloadable data

Versioned CSV datasets and machine-readable methodology files that make the underlying scenarios available.

Calculation verification

Independent checks, reproducibility tests, and verification reports document whether the published calculations match the study rules.

Interactive analysis

Charts and scenario explorers help readers examine the tested results beyond the headline numbers while staying tied to the published dataset.

Put the research into practice

Run the numbers for your own scenario

The studies use fixed scenario grids. These calculators and the Debt Payoff Planner let you apply the same questions to values you choose.